downside-up I
using
three non-transparent fabrics, a space is defined in which the sounds
and image of the world we encounter every day are taken from their
original spatial heritance and are replaced on the opposite.
the
beginning of the installation gives a small introduction, using the
sounds and images in their correct spatial configuration i.e. the sound
of rain hitting an umbrella or a roof will be played from speaker
located above the visitor and i.e. footstep sound will appear on the
ground; images of footsteps on the ground and some graphical
representation of clouds will be projected on the top of the space.
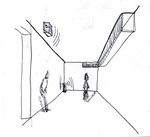
the sounds and images will be presented singly and in coherence with each other, in different sequences, at times in their correct natural order of spatial inhabitancy and then absolutely displaced.
there might be pressure sensors on the grounds which allow the visitor to interact with the presentation, changing the sequence or even physically being able to change the different elements, which means that sensors would have to trigger certain variables of the installation.
the visitor is confronted with the same world he/she walks and lives in every day, just seen from a new point of perspective and hopefully looses the orientation for a few seconds to then discover new details of the 'new' city of through the changED sound and
visual perspectives.
------------------------
rheinische post, 01.03.07
'auf dem kopf stehende bahn abgelehnt'
mehr
.......................................................................................................................................................................
X and Y I
the main idea is to capture a days activity in an x and y axis producing our own data using sensor technology that can be used and manipulated to document the time of the
installation.
installation.
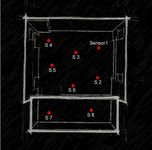
sensor positions Ts = time spent TD = time of day
using sensors on specific spots within the installation, the time that a visitor has spent in that area should be recorded and simultaneously the time of day needs to be specified and marked in some kind of data format. these two timelines will later be defined as the x and y axis.
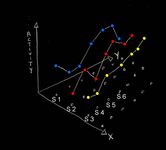
at the end of the exhibit there will be several data records for each sensor, which can then be graphed in the z axis (z = day1, day2, etc.). the various points within one day will be connected to the referring points of the other days.
the result is a three-dimensional map representing the activity throughout our installation in coherence with the time of day. what the outcome will be used for is very open at this point. one possible concept behind for the manipulation of the collected data
could be the creation of weather.
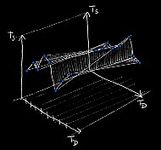
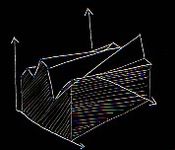
surface i.e. day1 and day2 object i.e. day1 and day2
this way the visitor will become integrated into the installation in a subconscious way, his/her actions will form a part of the art which will be presented at some point during the visit.
digital patchwork I

Trigger --> Closes Space
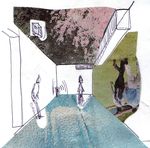
further the visitor in this space becomes part of the three dimensional image, leaving his/her shadow on the following screen.
an example for the projections in coherence with the threshold scheme could be a very literal one, using various images of doors found in different places of Edinburgh.
the first screen is fabricated in a way that the projection of the doorframe remains on it etc., which creates the illusion of a third dimension when seen from the front.
further there could be sensors placed on the ground within the space or in front of the space which could either have an effect on randomly changing the projection or trigger some kind of movement and effect the orientation of the screen, either blocking the visitor’s way or guiding him/her out of the space. this means that sensors would have to be able to implement the data received in a mechanical shifting.
.......................................................................................................................................................................
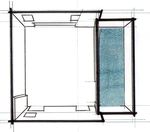
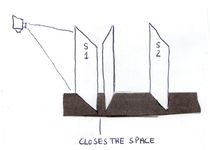
digital patchwork I
using
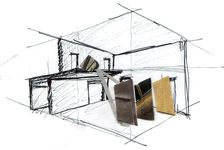
one projector on three vertically aligned fabric screens, a two
dimensional image should be converted into a three dimensional stage. three different patchworks of fabrics which are stretched over a wooden
frame construction, creating a screen and placed vertically behind each
other, are used to maintain projections on them from one direction.
depending
on the fabrics transparency in a certain space on the first screen it
will either let the projection pass on to the second screen or remain
on the first one. the same course is taken between the second and third
screen. the idea inhabits the necessity of leaving enough space between
the single frames to let the visitor explore
the second and third dimension physically.
the second and third dimension physically.
Trigger --> Closes Space
further the visitor in this space becomes part of the three dimensional image, leaving his/her shadow on the following screen.
an example for the projections in coherence with the threshold scheme could be a very literal one, using various images of doors found in different places of Edinburgh.
the first screen is fabricated in a way that the projection of the doorframe remains on it etc., which creates the illusion of a third dimension when seen from the front.
further there could be sensors placed on the ground within the space or in front of the space which could either have an effect on randomly changing the projection or trigger some kind of movement and effect the orientation of the screen, either blocking the visitor’s way or guiding him/her out of the space. this means that sensors would have to be able to implement the data received in a mechanical shifting.
.......................................................................................................................................................................
X and Y(2) I
another way of creating a three-dimensional map can be achieved by actually structuring the space in coordinates, using sensors. rather than connecting the days in the end and developing a map, the map would already be a three-dimensional space, recording the amount of time a visitor spends in one certain space.
this way the amount of maps could be chosen pretty freely or randomly, (i.e. minutes, hours or days), depending on the concept of this part of the installation. the data can be manipulated in a way, representing sound waves or graphical patterns which conclude or just document something every minute, day or all at the end.
this way the amount of maps could be chosen pretty freely or randomly, (i.e. minutes, hours or days), depending on the concept of this part of the installation. the data can be manipulated in a way, representing sound waves or graphical patterns which conclude or just document something every minute, day or all at the end.
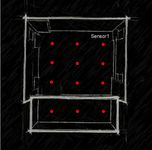 sensor positions
the areas in which the sensors are placed must be chosen in a way that they are not disturbing to the visitor during the visit, but the outcome or the influence the visitors have should be made visible i.e. projections of weather changes, digital manipulation
creating some kind of patterns etc. taking this thought a step further and making the visitors influence more personal, GPS systems could be attached to them. the sensors however would have to be able to trigger this informatio additionally and individually.
on leaving the installation the visitor can receive a three dimensional map of his/her time spent at the installation and the effect it might have had in comparison to all the collected data.
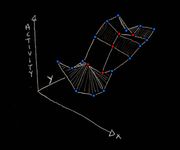
sensor data for activity data created i.e. “landscape”
the wall outside in the back of the building could be used for some kind of projection. one could project the graph (or the activity of a visitor could be visualized) or whatever forms of manipulation the data has been processed by onto the wall, like live streaming
information.
information.